
Articles
- Page Path
- HOME > J Korean Soc Clin Toxicol > Volume 21(2); 2023 > Article
-
Original Article
급성일산화탄소 중독환자에서 고압산소치료의 압력에 따른 예후 비교 -
김정윤1
 , 임지혜2, 김성화2, 한상일1,3, 차용성1,3
- Comparison of hyperbaric oxygen therapy pressures for acute carbon monoxide poisoning
-
Jeong Yun Kim, M.D.1, Jihye Lim, B.S.2, Sung Hwa Kim, B.S.2, Sang Il Han, M.D.1,3, Yong Sung Cha, M.D., Ph.D.1,3
-
Journal of The Korean Society of Clinical Toxicology 2023;21(2):117-127.
DOI: https://doi.org/10.22537/jksct.2023.00012
Published online: December 29, 2023
- 428 Views
- 8 Download
1연세대학교 원주의과대학 응급의학교실
2연세대학교 원주의과대학 의통계학과
3연세대학교 원주의과대학 고압의과학연구소
1Department of Emergency Medicine, Yonsei University Wonju College of Medicine, Wonju, Korea
2Department of Biostatistics and Center of Biomedical Data Science, Yonsei University Wonju College of Medicine, Wonju, Korea
3Research Institute of Hyperbaric Medicine and Science, Yonsei University Wonju College of Medicine, Wonju, Korea
- Corresponding author: Yong Sung Cha Department of Emergency Medicine, Yonsei University Wonju College of Medicine, 20 Ilsan-ro, Wonju 26426, Korea Tel: +82-33-741-1615 Fax: +82-33-742-3030 E-mail: emyscha@yonsei.ac.kr
Copyright © Korean Society of Clinical Toxicology
This is an Open Access article distributed under the terms of the Creative Commons Attribution Non-Commercial License (http://creativecommons.org/licenses/by-nc/4.0/) which permits unrestricted non-commercial use, distribution, and reproduction in any medium, provided the original work is properly cited.
Abstract
-
Purpose
- No consensus currently exists regarding the maximal pressure of hyperbaric oxygen (HBO2) therapy performed within 24 hours of acute carbon monoxide (CO) poisoning. This study aimed to evaluate the difference in therapeutic effects according to the first HBO2 pressure (3.0 atmospheres absolute [ATA] vs. 2.8 ATA).
-
Methods
- We used prospectively collected registry data on CO poisoning at a tertiary academic hospital in the Republic of Korea. Adult patients with acute CO poisoning treated with HBO2 within 24 hours after arrival at the emergency department and without the use of additional HBO2 after 24 hours between January 2007 and February 2022 were included. Data from 595 patients were analyzed using propensity score matching (PSM). Patients with mild (non-intubated) and severe (intubated) poisoning were also compared. Neurocognitive outcomes at 1 month after CO poisoning were evaluated using the Global Deterioration Scale combined with neurological impairment.
-
Results
- After PSM, the neurocognitive outcomes at 1-month post-CO exposure were not significantly different between the 2.8 ATA (110 patients) and 3.0 ATA (55 patients) groups (p=1.000). Similarly, there was also no significant difference in outcomes in a subgroup analysis according to poisoning severity in matched patients (165 patients) (mild [non-intubated]: p=0.053; severe [intubated]: p=1.000).
-
Conclusion
- Neurocognitive sequelae at 1 month were not significantly different between HBO2 therapy pressures of 2.8 ATA and 3.0 ATA in patients with acute CO poisoning. In addition, the 1-month neurocognitive sequelae did not differ significantly between intubated and non-intubated patients.
- Carbon monoxide (CO) is a colorless, tasteless, and odorless gas, and thus, CO poisoning is not perceptible to those exposed to it1). In the United States, approximately 50,000 people are brought to the emergency departments (EDs) annually due to CO poisoning, and an average of 1,500 people die from CO poisoning2,3). Headache, dizziness, weakness, nausea, vomiting, confusion, misdirection, blindness, and difficulty breathing are the common symptoms of CO poisoning1). Cognitive sequelae occur in 25%–50% of people with acute CO poisoning4), and those with severe poisoning may develop convulsions and cardiopulmonary arrest1).
- Hyperbaric oxygen therapy (HBO2) reduces neurocognitive complications in symptomatic patients with acute CO poisoning4,5). Weaver et al.4) conducted a double-blind randomized controlled trial (RCT) of HBO2 therapy thrice with a maximum pressure of 3.0 atmospheres absolute (ATA) within 24 hours in patients with acute CO poisoning. The results showed that neurocognitive complications were significantly decreased after 6 weeks and 12 months. In another RCT performed by Thom et al.5), the maximum pressure of HBO2 was 2.8 ATA, and HBO2 treatment reduced the incidence of neurocognitive complications in patients with mild-to-moderate CO poisoning6).
- One of most effective mechanisms of HBO2 therapy for the inflammatory reaction of CO poisoning is the inhibition of human β2-integrin-dependent adherence of HBO2, which is observed at 2.8 or 3.0 ATA7). To date, all reports of using 2.0 ATA showed no therapeutic effect of HBO28,9), whereas using 3.0 ATA had a therapeutic effect4,5,10). In addition, because previous RCTs showed the effectiveness of HBO2 therapy in reducing neurocognitive sequelae, both 3.0 ATA and 2.8 ATA may be a reasonable recommended pressure within 24 hours of CO poisoning for symptomatic patients4,5). However, the optimal pressure (3.0 ATA versus 2.8 ATA) with respect to neurocognitive outcomes in acute CO poisoning remains unclear.
- Therefore, this study aimed to evaluate the difference in therapeutic effect according to the first HBO2 pressure (3.0 ATA versus 2.8 ATA) used in patients with acute CO poisoning who received HBO2 therapy within 24 hours after CO poisoning.
INTRODUCTION
- 1. Study design and population
- This cohort study extracted data from a cohort of a single tertiary academic hospital in the Republic of Korea. Patients who visited the ED of Wonju Severance Christian Hospital for acute CO poisoning between January 2006 and February 2022 were included. Since January 2006, a CO poisoning registry has been used to prospectively collect consecutive patient data in our hospital. From August 2020, data were prospectively collected with the “CARE CO cohort” informed consent (ClinicalTrials.gov identifier: NCT04490317). This study was approved by the institutional review board of Wonju Severance Christian Hospital (approval number: CR322003) and was conducted according to the tenets of the Declaration of Helsinki.
- Adult patients with CO poisoning treated with HBO2 within 24 hours after rescue from CO exposure and without use of additional HBO2 after 24 hours from ED arrival (EDA) were eligible. We excluded patients aged <16 years; those aged >70 years were also excluded owing to aging-related senile changes in neurocognitive function. The patients with the following characteristics were also excluded: (1) previous stroke or neurocognitive disorder, (2) previous CO poisoning, (3) serious illness such as advanced cancer, (4) other specific treatment (therapeutic hypothermia or steroid), (5) no follow-up for neurocognitive outcome at 1 month, and (6) missing data for important variables.
- 2. Treatment protocol
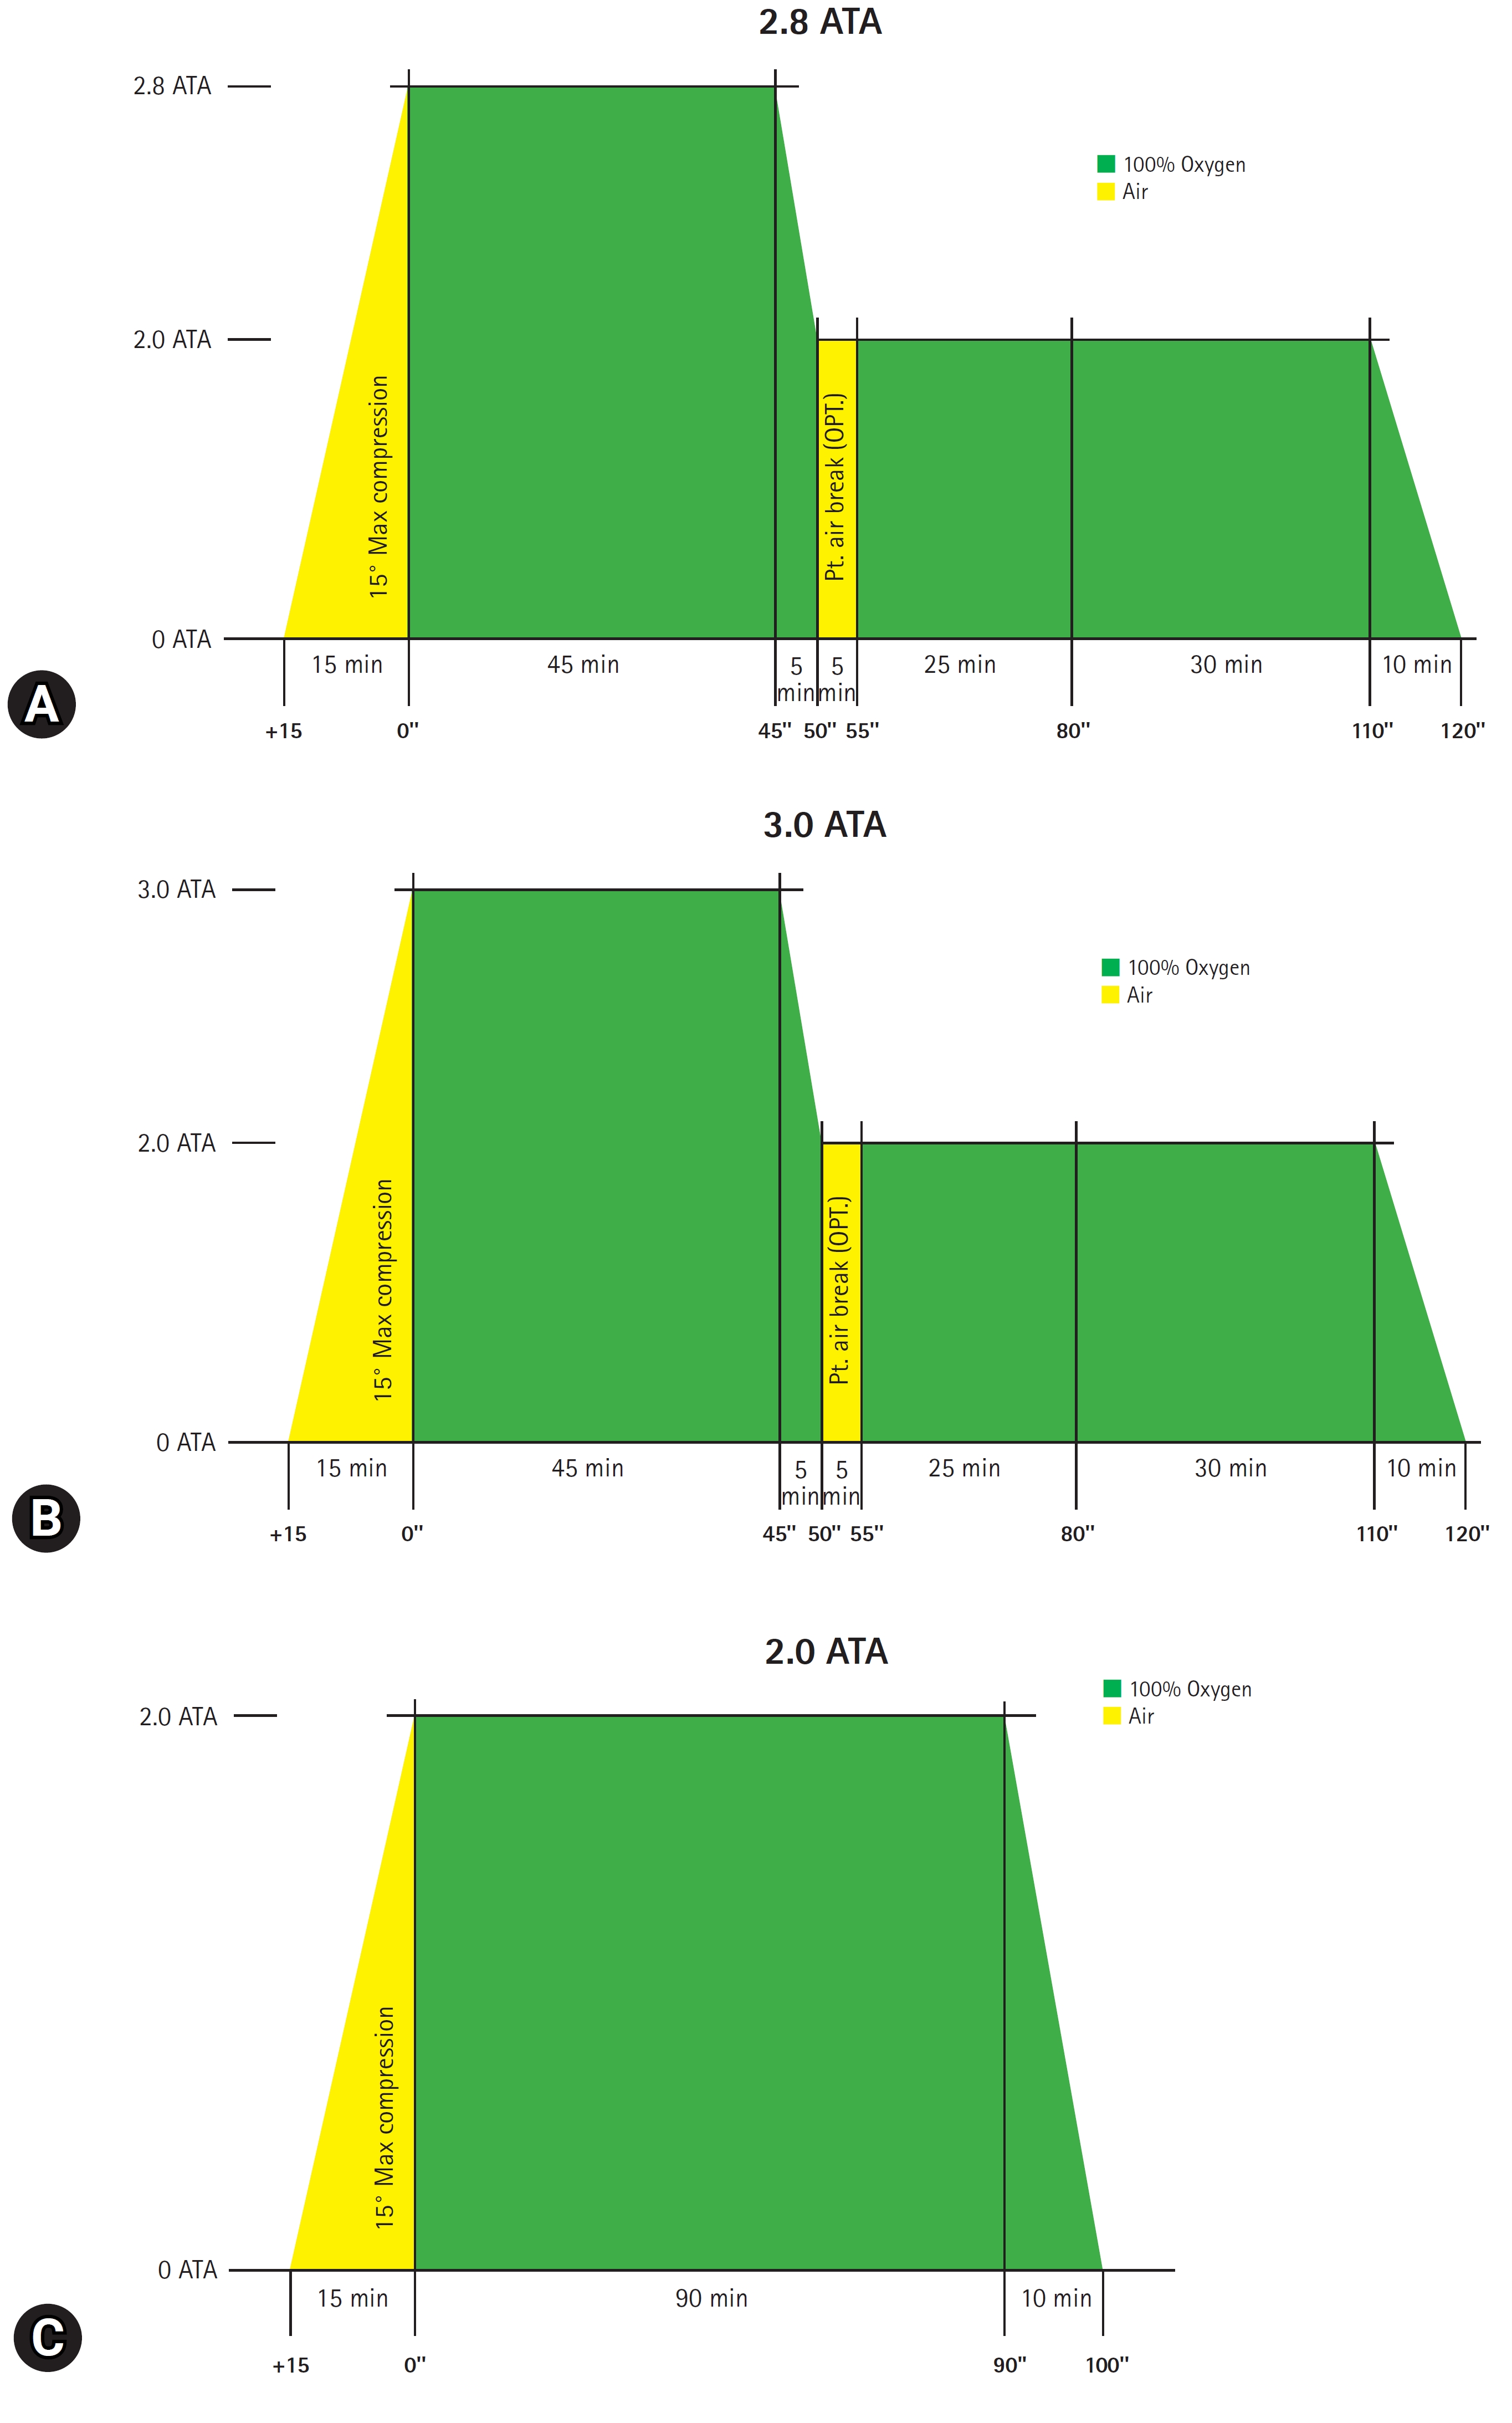
- In our institute, acute CO poisoning is diagnosed according to the patient’s or guardian’s history report and carboxyhemoglobin levels (CO-Hb) >5% (>10% for heavy smokers). Patients with CO poisoning are treated with 100% oxygen therapy through a facemask with a reservoir bag. Patients with any loss of consciousness intervals, neurocognitive symptoms or signs, cardiovascular dysfunction, elevated cardiac enzymes, ischemic electrocardiogram changes, severe acidosis, or CO-Hb ≥25% were treated with HBO26). First, HBO2 was delivered at a pressure of 2.8 ATA or 3.0 ATA for 45 minutes and then maintained at a pressure of 2.0 ATA for 60 minutes (Fig. 1A, B). Additional HBO2 was delivered at a pressure of 2.0 ATA for 90 minutes without air break (Fig. 1C). Treatment was performed with a maximum pressure of 2.8 ATA until January 2021 and 3.0 ATA after February 2021.
- 3. Variables and definitions
- Information on the following clinical variables were collected: age, sex, intentionality, source of CO poisoning (charcoal, gas and oil, and fire), number of HBO2 therapies within 24 hours after ED arrival, CO exposure time (hr), time from rescue to HBO2 (hr), drug co-ingestion, Glasgow Coma Scale (GCS) score at the site of rescue or ED arrival, comorbidities (diabetes mellitus, hypertension, cardiovascular disease, psychiatric disease), smoking history, symptoms or signs (loss of consciousness, shock, or seizure), laboratory findings (CO-Hb, bicarbonate, lactate, creatinine, creatine kinase, and troponin I), and intubation.
- The patients were classified into two groups as the 2.8 ATA and 3.0 ATA treatment groups. In subgroup analysis, mildly and severely poisoned patients were defined as those not requiring and requiring intubation, respectively11). Neurocognitive outcomes after CO poisoning were evaluated using the Global Deterioration Scale (GDS) combined with neurological impairment at 1-month post-CO exposure on visits to the rehabilitation outpatient department12). Guardians of patients in poor condition who were unable to visit the rehabilitation outpatient department were interviewed to assess the patients’ conditions. The GDS was divided into seven stages from stages 1 to 7. Stage 1 was defined as no cognitive decline; stage 4, moderate cognitive decline; and stage 7, very severe cognitive decline. GDS stages 1–3 were classified as the favorable outcome group, while GDS stages 4–7 were classified as the poor outcome group. However, patients belonging to the favorable outcome group, but with neurological impairment, (e.g., motor weakness or dysarthria) were assigned to the poor outcome group. Patients who had CO-related death within 1 month after CO poisoning were classified as having GDS stage 7.
- 4. Outcome measures
- The primary outcome measure was to compare the difference in 1-month neurocognitive outcomes according to the maximum treatment pressure of HBO2 (2.8 ATA versus 3.0 ATA) in patients with acute CO poisoning. The secondary outcome measures included neurocognitive outcomes at 1-month post-CO exposure in the 2.8 ATA group compared with those in the 3.0 ATA group according to the severity of poisoning (mild [non-intubated] versus severe [intubated]).
- 5. Statistical analyses
- Propensity score matching (PSM) using the nearest neighbor method was conducted to reduce selection bias in the observational study and control for confounding variables. Propensity scores were estimated through logistic regression with statistically and clinically significant variables. The score assigned to each patient was used to reduce bias in estimating treatment effects13). The matching ratio between the treatment group and the control group is generally 1:1 or 1:214). In this study, the ratio was 1:2 because the 2.8 ATA group was larger than the 3.0 ATA group. The caliper width was set as 0.2 based on previous findings15). Matching balance was confirmed based on the absolute value of the standardized mean difference within 0.2516).
- Data are reported as the median (interquartile range) for continuous variables and as frequencies (percentages) for categorical variables, before and after matching. The normality of distribution of continuous variables was assessed using the Shapiro-Wilks test. Comparisons between the 2.8 ATA and 3.0 ATA groups were performed using the chi-square test for categorical variables and the Mann-Whitney U test for continuous variables. All statistical analyses were performed using SAS statistical software ver. 9.4 (SAS Institute Inc., Cary, NC, USA) and R ver. 4.1.2 (R Core Team, Vienna, Austria). Statistical significance was confirmed at p<0.05.
METHODS
- 1. Patient characteristics
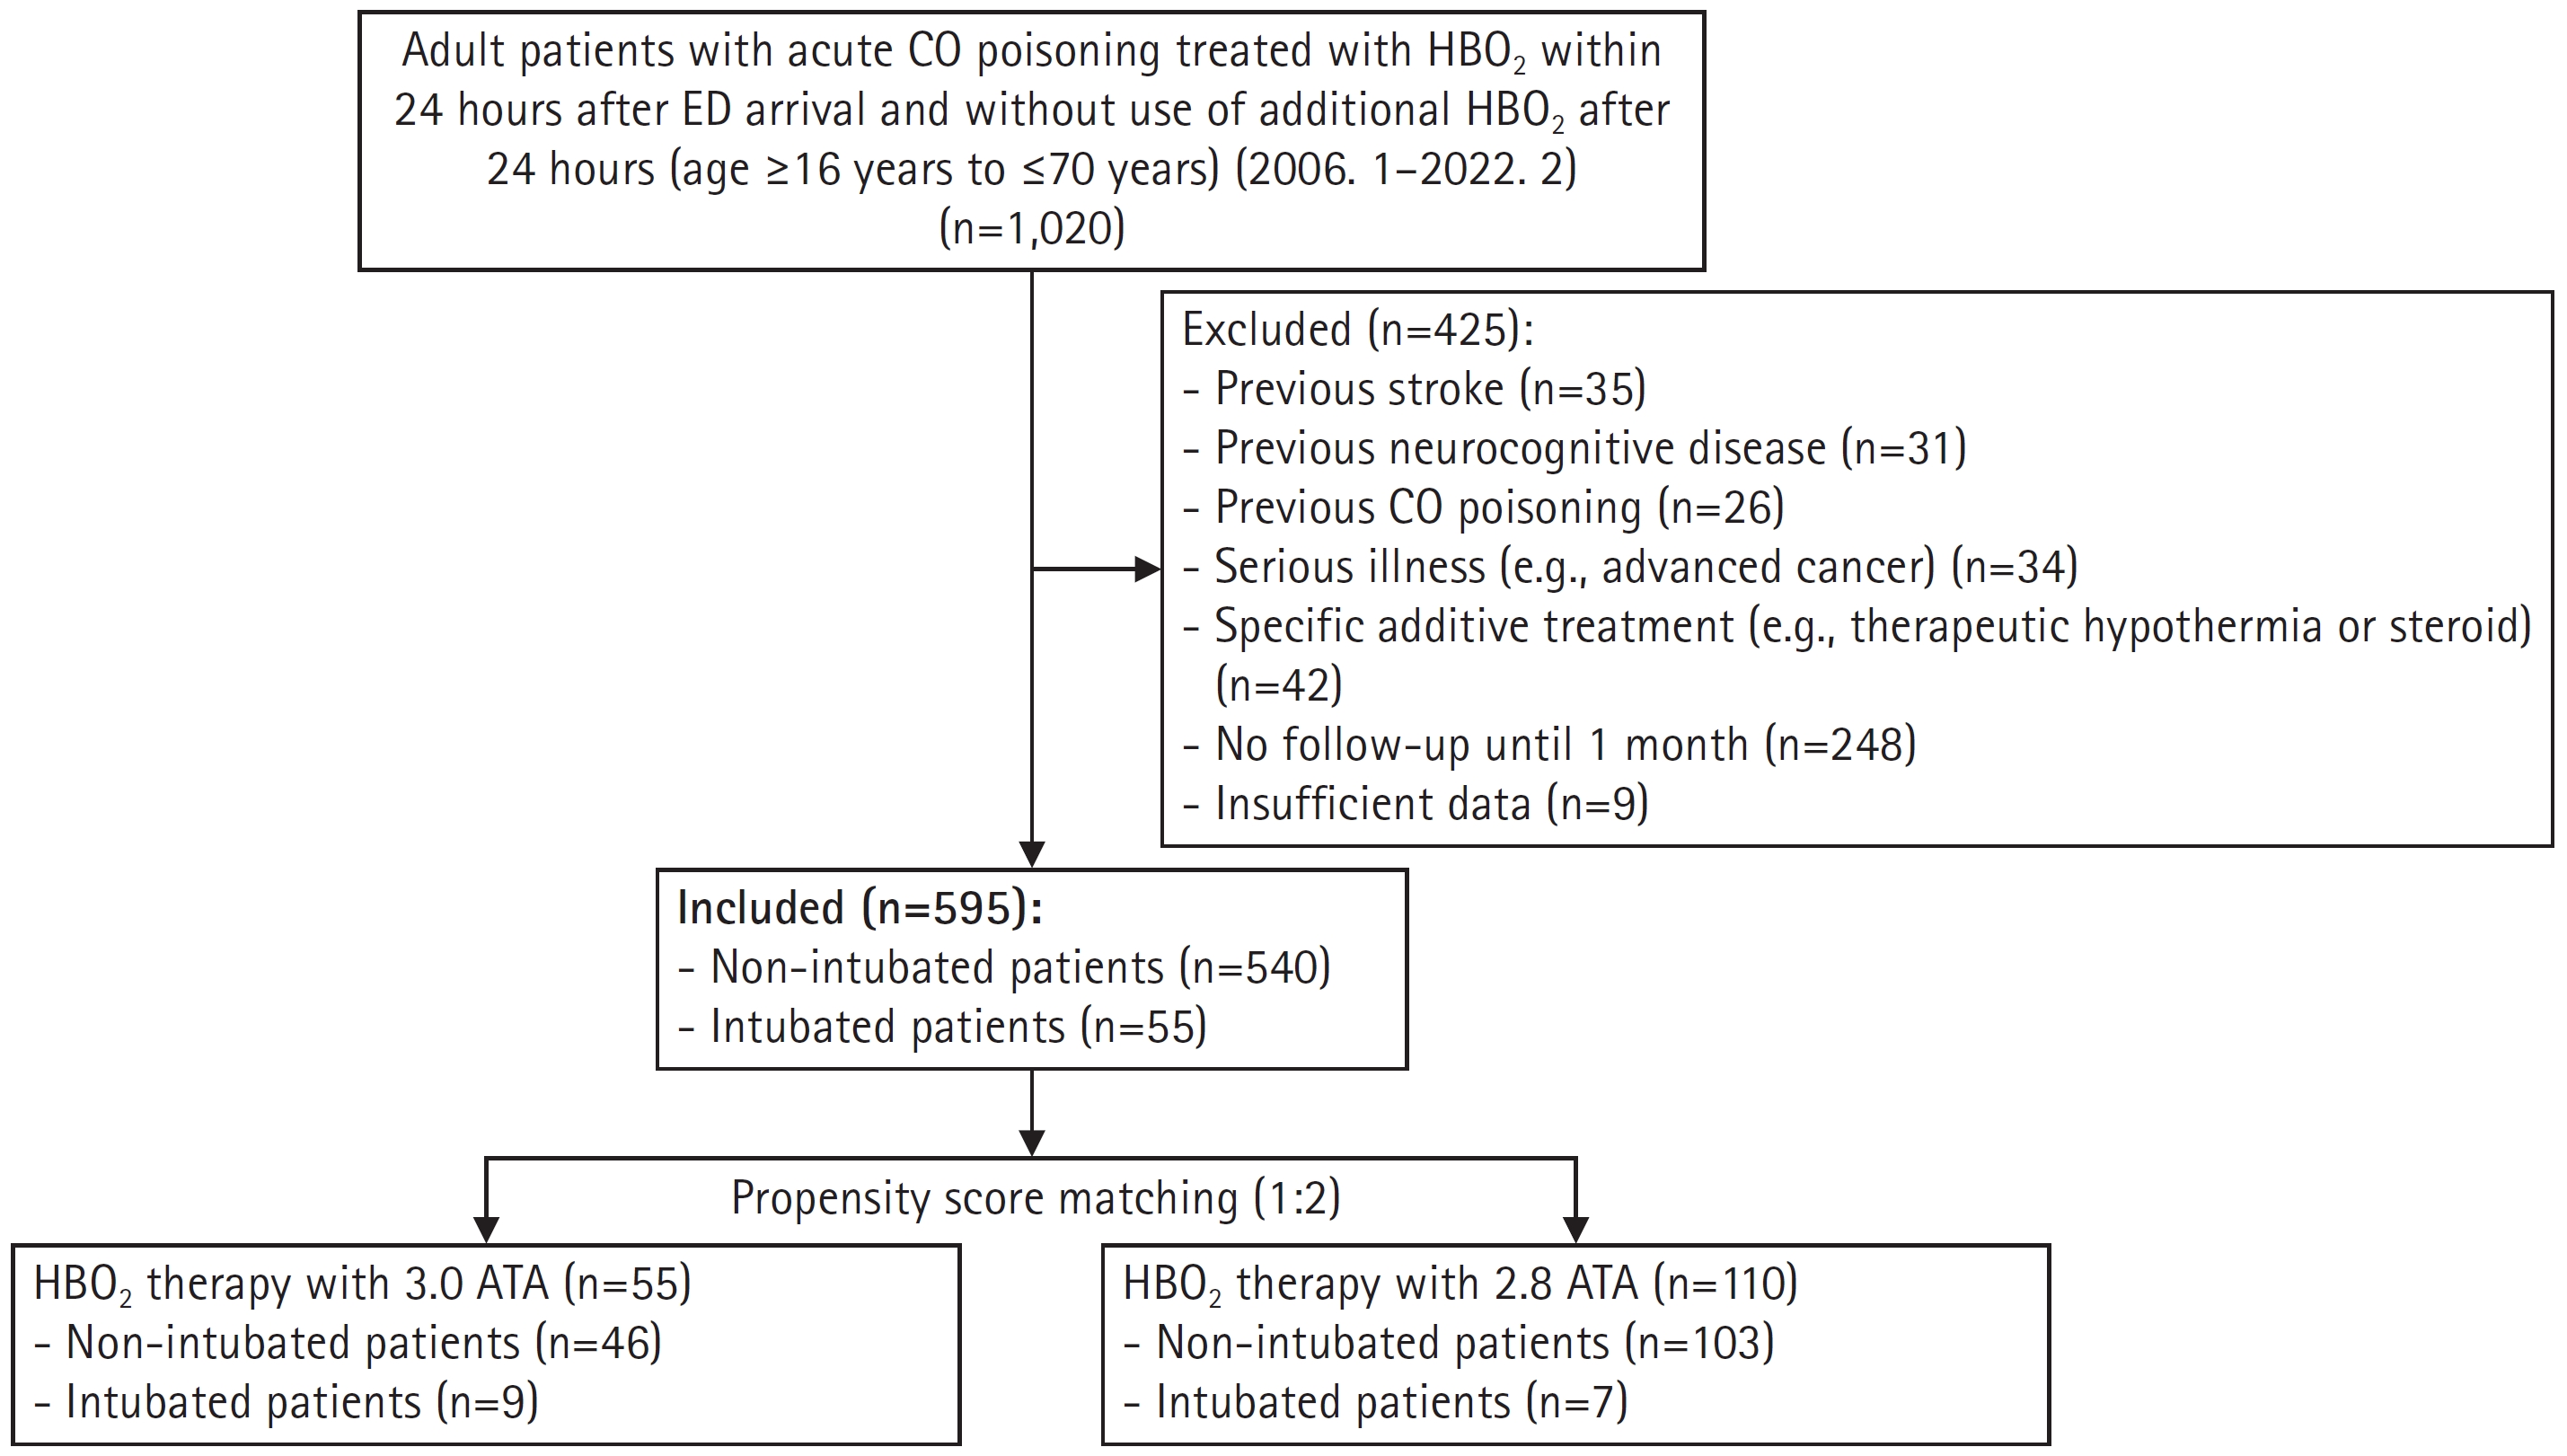
- In total, 1,020 patients were identified, and 595 were included in the final analysis. Among them, 540 patients and 55 patients received initial HBO2 therapy with 2.8 ATA and 3.0 ATA, respectively (Fig. 2). The median age of the total cohort was 45.0 years, and 65.4% were male individuals. The most common source of CO poisoning was charcoal (76.5%). HBO2 therapy was performed only once within 24 hours of ED arrival in 497 patients (83.5%). The median CO exposure time and the time from rescue to HBO2 therapy were 3.0 hours and 5.3 hours, respectively. The most common comorbidity was hypertension (14.5%). In total, 48 patients (8.1%) were intubated. We showed that baseline patient characteristics before and after PSM in the total cohort in Table 1.
- A total of 560 patients (94.1%) and 35 patients (5.9%) had favorable outcomes (GDS 1–3) and unfavorable outcomes (GDS 4–7), respectively. Three patients with GDS stages 4, 5, and 6 had neurological symptoms (motor weakness, speech disturbance, or peripheral neuropathy). Therefore, the neurocognitive outcome group classified by GDS stage combined with neurological impairment was not different from the outcome group categorized by GDS stage alone. In the analysis of whether the 1-month GDS stage changed 6 months after CO poisoning, 559 patients were followed up for up to 6 months. The GDS stage remained unchanged in 517 patients (92.5%) before PSM, while it improved in 40 (7.1%) and worsened in 2 (0.4%). There was no significant difference in neurocognitive outcomes between 1-month and 6-month GDS stage (p=1.000) (Table 2).
- 2. Patient characteristics according to HBO2 pressure
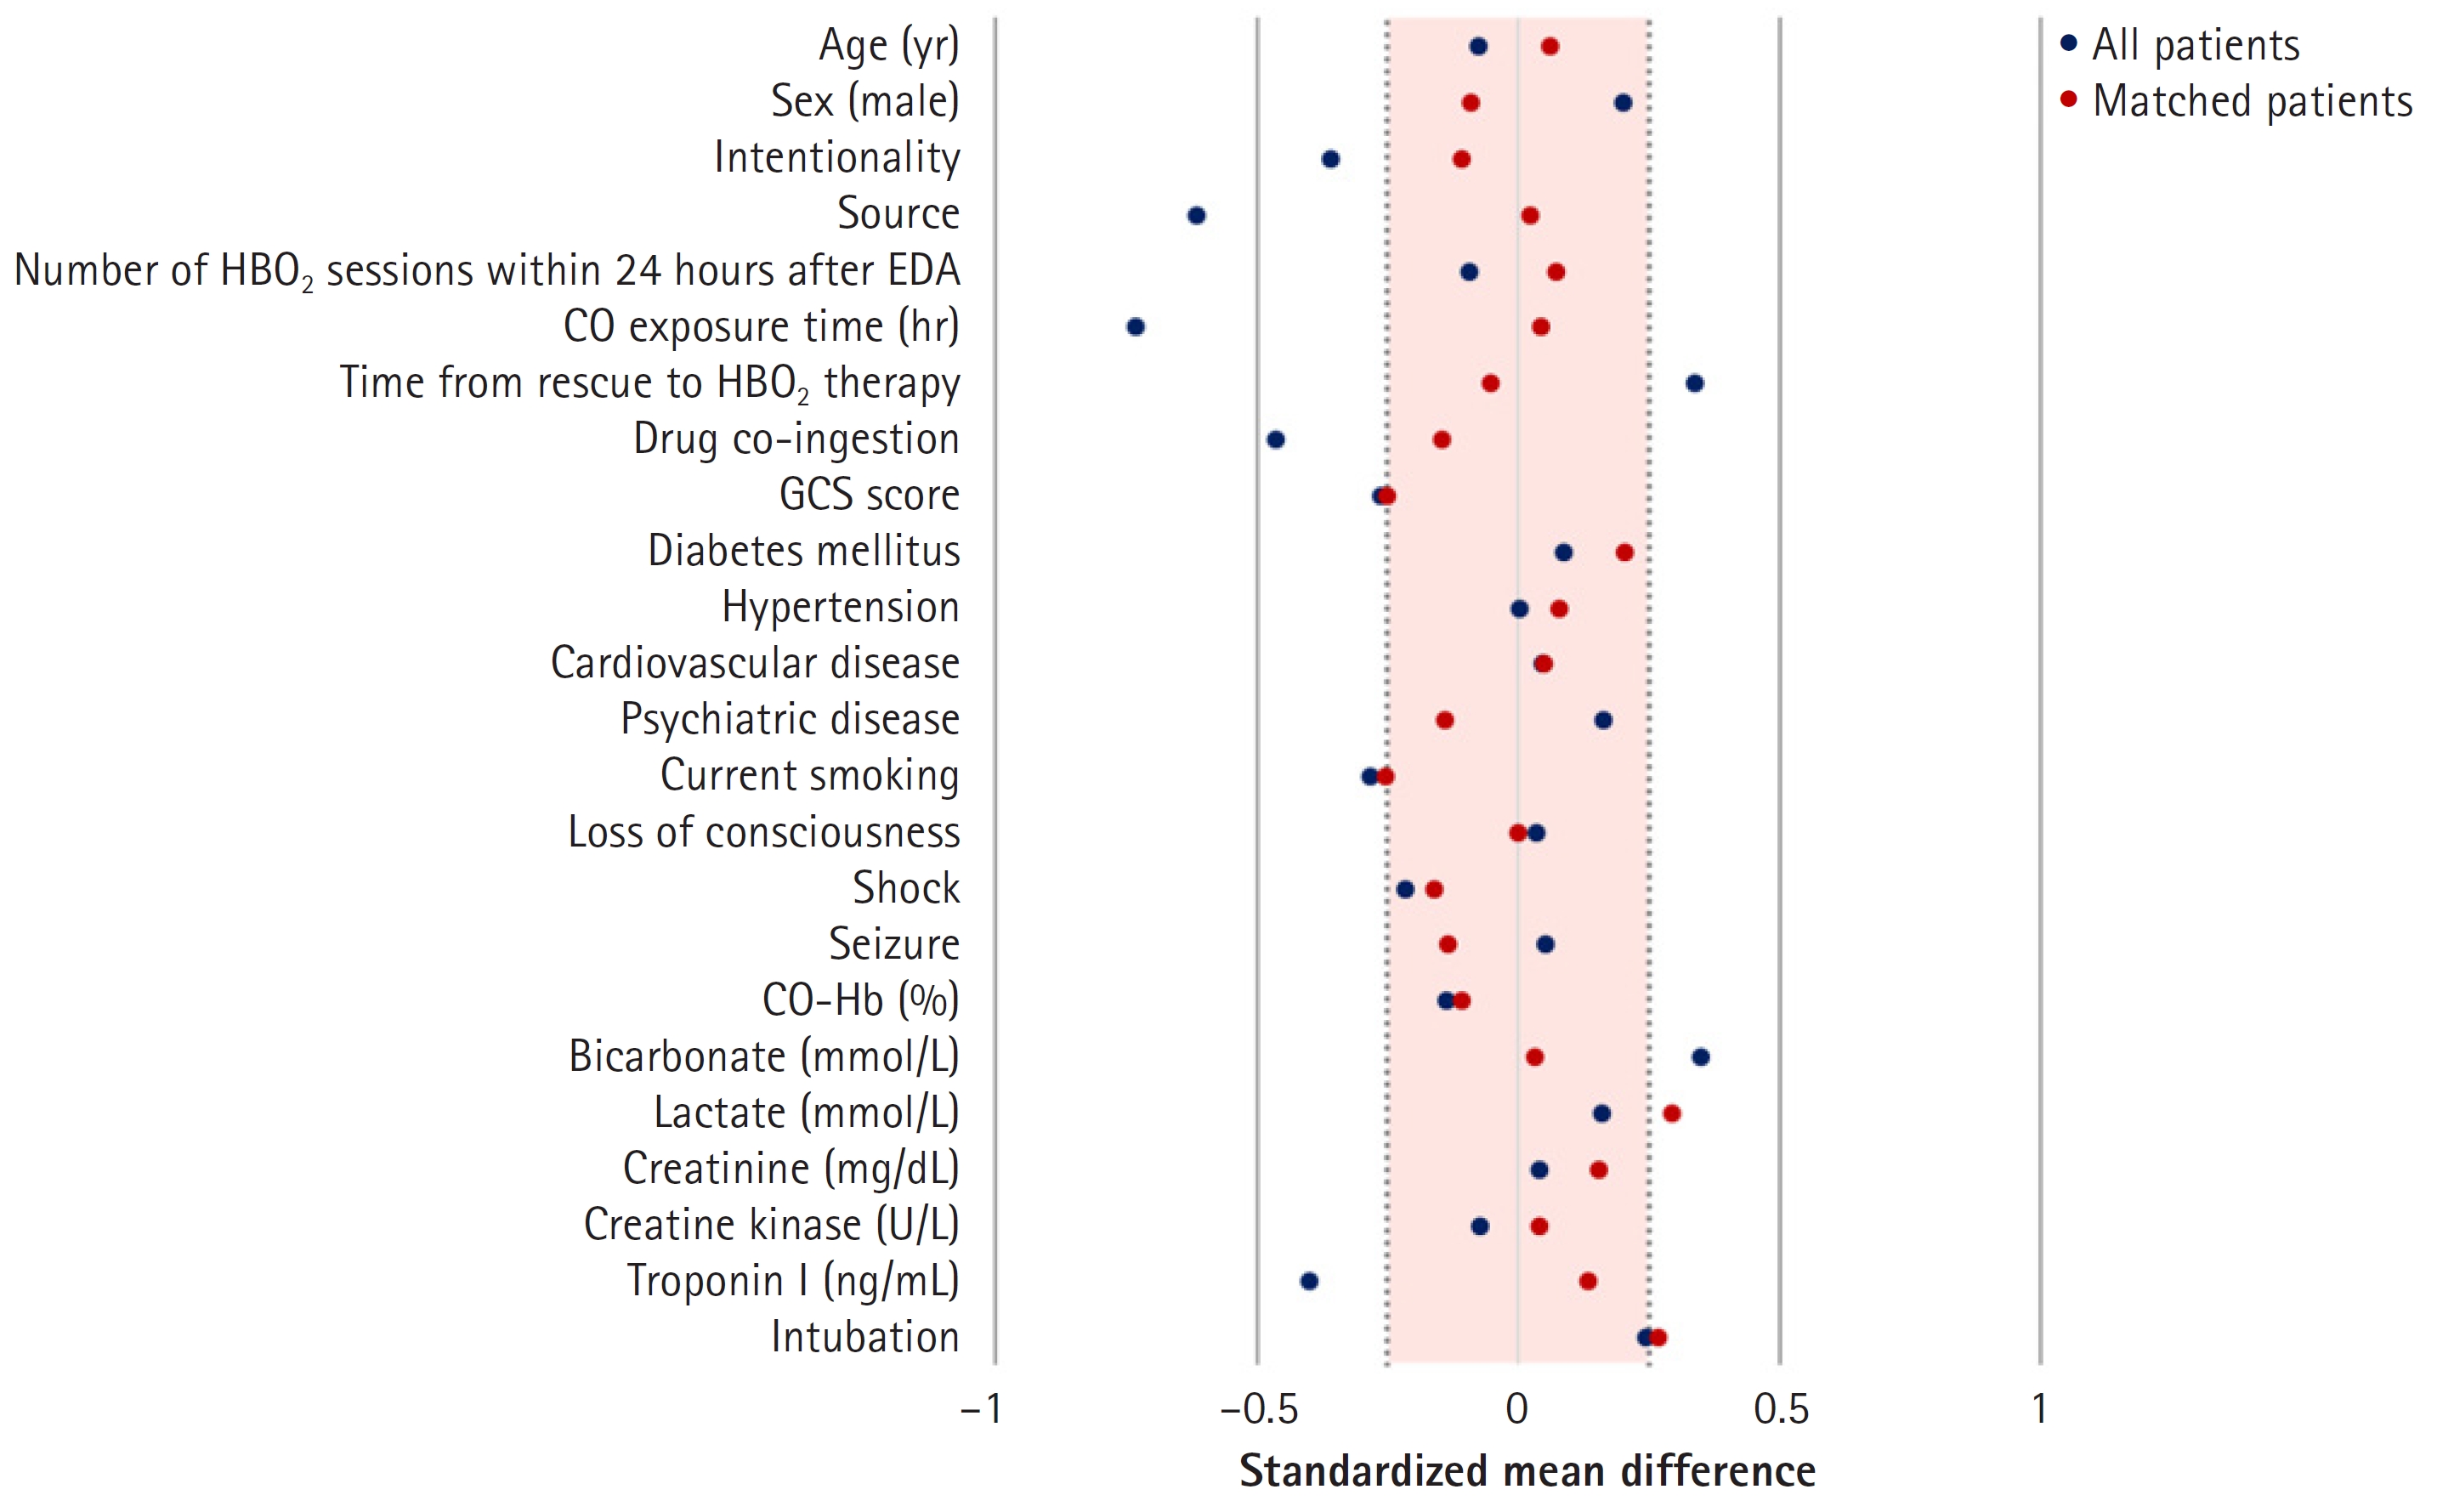
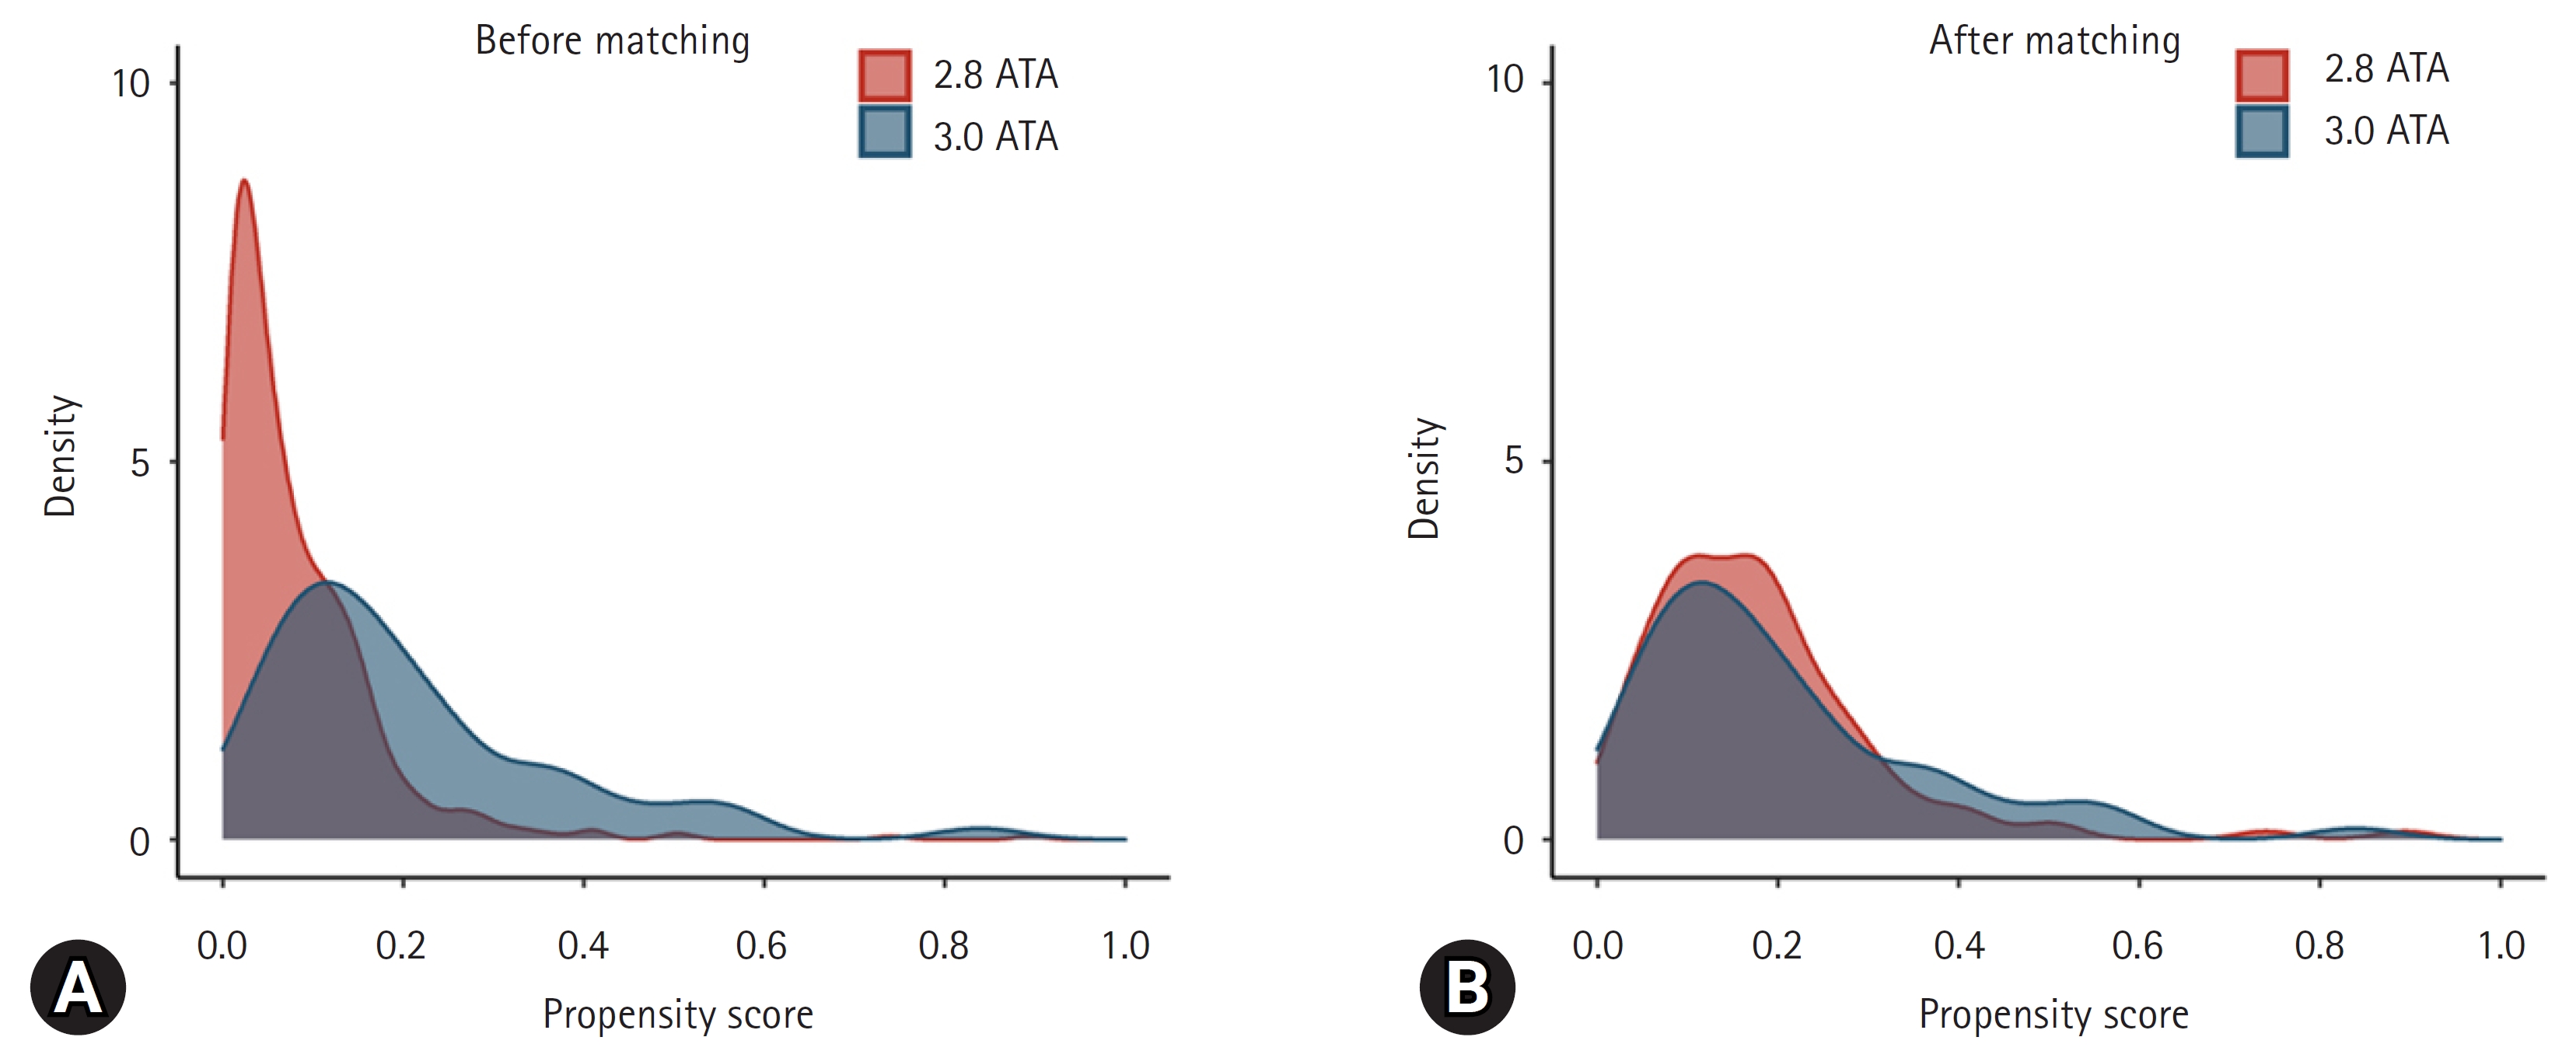
- There were significant differences in intentionality, CO source, CO exposure time, time from rescue to HBO2, drug co-ingestion, GCS score, shock, bicarbonate, troponin I, and intubation rates between the 2.8 ATA and 3.0 ATA groups. However, the groups were well balanced after PSM, as confirmed based on the absolute value of the standardized mean difference within 0.25 (Fig. 3)16). Before matching, there was a difference in the distribution of propensity scores between the 2.8 ATA and 3.0 ATA groups, although the distribution was generally consistent after matching, confirming group homogeneity (Fig. 4).
- 3. Neurocognitive outcomes
- Intentionality, source of CO poisoning, CO exposure time, time from rescue to HBO2, drug co-ingestion, GCS score, shock, bicarbonate, and troponin I were significantly different between the 2.8 ATA and 3.0 ATA groups. Therefore, PSM for these variables were performed. In addition, because variables with no significant difference (age, sex, number within 24 hours after EDA, creatine kinase) were considered to be clinically important, PSM was performed with these variables. There was no difference in neurocognitive outcome after PSM between the 2.8 ATA and 3.0 ATA groups (Table 1). In subgroup analysis according to intubation in matched patients (n=165), no significant differences were observed between the 2.8 ATA and 3.0 ATA groups (Tables 3, 4).
RESULTS
- The optimal pressure for initial HBO2 therapy for acute CO poisoning is yet to be established. This study found no significant difference in the 1-month neurocognitive outcome between maximum pressures of 2.8 ATA and 3.0 ATA of HBO2 therapy as initial treatment in patients with acute CO poisoning. Subgroup analysis according to severity of poisoning (mild [non-intubated] versus severe [intubated]) also showed no significant difference in neurocognitive complications between these HBO2 pressures. Convulsions due to oxygen toxicity, which is a complication of HBO2 therapy, are more frequent in higher treatment pressures17). Other complications such as barotrauma of the middle ear, nasal sinus, and teeth can also occur due to increased pressure in HBO2 therapy. In this study, the seizure rate was 1.1% (6/540) in the 2.8 ATA group and 1.8% (1/55) in the 3.0 ATA group. Although there was no significant difference (p=0.495), the 3.0 ATA group showed a higher trend in seizure rate. Therefore, a minimal pressure with an optimal therapeutic effect is needed.
- The findings of this study can be understood with respect to the pathophysiology of CO poisoning and the mechanism of action of HBO2 therapy. Acute CO poisoning causes neutrophil degranulation by activating intravascular neutrophils through platelet-neutrophil aggregates18). When neutrophils are stimulated, they attach to vascular endothelial cells. This process leads to oxidative stress, the transformation of xanthine dehydrogenase to xanthine oxidase in endothelial cells, lipid peroxidation, and apoptosis by causing the release of myeloperoxidase, proteases, and reactive oxygen species18,19). Finally, these reactions induce an adaptive immunological response through microglia activation, causing CO-mediated neurocognitive sequelae through the formation of chemically modified myelin basic protein20). With respect to the mechanism of action of HBO2 therapy, Thom et al.7,21) reported that exposure to 2.8 ATA or 3.0 ATA HBO2 can transiently inhibit leukocyte β2-integrin function by S-nitrosylation and cell adherence to the cerebral microvasculature, inhibiting the sequential immunological reaction, as shown in both animal and human studies. However, there was no statistically significant decrease in 2.0 ATA. Therefore, at a pressure of 2.8 ATA or higher, neutrophil adhesion, which causes neurocognitive complications of acute CO poisoning, can be inhibited.
- Ducasse et al.10) conducted an RCT comparing between normobaric oxygen therapy and HBO2 with 2.4 ATA in non-comatose patients, and the results showed that HBO2 therapy was associated with lower initial recovery time and number of neurological sequelae. However, their study had some limitations including no calculation of sample size, small sample size (total 26 patients), and no description of the randomization method. Although no study has directly compared the therapeutic effects of 2.8 ATA with those of 3.0 ATA, one pilot RCT compared the therapeutic effects between 2.4 ATA (n=18) and 3.0 ATA (n=12)22). A neurocognitive screening test was performed immediately after HBO2 therapy and repeated 14–21 days later. The results showed no significant difference in outcomes between 2.4 ATA and 3.0 ATA. However, the study had some limitations including no calculation of sample size, a small sample size (30 patients), enrollment of only fully conscious patients, and randomization method (the selection of a sealed envelope). Additional RCTs are needed with respect to the therapeutic effects of 2.4 ATA.
- There are a few limitations to this study. First, this was an observational, non-randomized study. However, from an analytical perspective, PSM was used to minimize bias owing to the study design23). In addition, although a large number of patients were excluded for accurate comparison, to the best of our knowledge, this was the first study with a large sample size (>500 patients). Second, the number of patients who received 3.0 ATA HBO2 therapy was small. Third, although RCTs have conducted more than six neurocognitive tests, usually equivalent to CO batteries4,5), we only evaluated outcomes using the GDS stage combined with neurological impairment. Our institute uses the GDS stage to evaluate neurocognitive prognosis in patients with CO poisoning because it has the advantage of recognizing neurocognitive functions (e.g., memory and concentration), as well as activities of daily living, through interviews. We have previously reported the GDS stage for the measurement of neurocognitive outcomes in a study related to CO poisoning11,24,25). Fourth, some patients were lost to follow-up due to their condition, distance from the hospital, or poor compliance. Fifth, although we compared intubated and non-intubated patients, further studies are needed because of the small number of these patients. Sixth, we only compared the 1-month outcomes. Studies comparing outcomes at longer time points (6 months and 1 year) may be needed. Further studies that address the study limitations will be needed.
DISCUSSION
- Neurocognitive sequelae at 1 month do not differ according to the initial HBO2 maximal pressure (2.8 ATA versus 3.0 ATA) in patients with acute CO poisoning. In addition, they also do not differ in patients with mild and severe poisoning. Therefore, we suggest the use of 2.8 ATA in HBO2.
CONCLUSION
-
Acknowledgement
- This work was supported by the Korea Medical Device Development Fund grant funded by the Korea government (the Ministry of Science and ICT) (Project Number: RS-2020-KD000247).
Values are presented as median (range) or frequency (%). Statistically significant results are marked in bold.
PSM: propensity score matching, ATA: atmospheres absolute, HBO2: hyperbaric oxygen, ED: emergency department, CO: carbon monoxide, GCS: Glasgow Coma Scale, CO-Hb: carboxyhemoglobin, GDS: Global Deterioration Scale.
| 1-Month GDS vs. 6-month GDS | Total |
HBO2 pressure |
p-value | |
|---|---|---|---|---|
| 2.8 ATA (n=529) | 3.0 ATA (n=30) | |||
| Improved | 40 (7.1) | 38 (7.2) | 2 (6.7) | |
| No change | 517 (92.5) | 489 (92.4) | 28 (93.3) | 1.000 |
| Worsened | 2 (0.4) | 2 (0.4) | 0 | |
- 1. Raub JA, Mathieu-Nolf M, Hampson NB, Thom SR. Carbon monoxide poisoning: a public health perspective. Toxicology 2000;145:1-14. https://doi.org/10.1016/s0300-483x(99)00217-6ArticlePubMed
- 2. Hampson NB, Weaver LK. Carbon monoxide poisoning: a new incidence for an old disease. Undersea Hyperb Med 2007;34:163-8.PubMed
- 3. Hampson NB. U.S. mortality due to carbon monoxide poisoning, 1999-2014: accidental and intentional deaths. Ann Am Thorac Soc 2016;13:1768-74. https://doi.org/10.1513/AnnalsATS.201604-318OCArticlePubMed
- 4. Weaver LK, Hopkins RO, Chan KJ, Churchill S, Elliott CG, Clemmer TP, et al. Hyperbaric oxygen for acute carbon monoxide poisoning. N Engl J Med 2002;347:1057-67. https://doi.org/10.1056/NEJMoa013121ArticlePubMed
- 5. Thom SR, Taber RL, Mendiguren II, Clark JM, Hardy KR, Fisher AB. Delayed neuropsychologic sequelae after carbon monoxide poisoning: prevention by treatment with hyperbaric oxygen. Ann Emerg Med 1995;25:474-80. https://doi.org/10.1016/s0196-0644(95)70261-xArticlePubMed
- 6. Weaver LK. Carbon monoxide poisoning. In: Moon RE, editors. Hyperbaric oxygen therapy indications. 14th ed. North Palm Beach (FL): Best Publishing Company; 2019. p. 81-104.
- 7. Thom SR, Mendiguren I, Hardy K, Bolotin T, Fisher D, Nebolon M, et al. Inhibition of human neutrophil beta2-integrin-dependent adherence by hyperbaric O2. Am J Physiol 1997;272(3 Pt 1):C770-7. https://doi.org/10.1152/ajpcell.1997.272.3.C770ArticlePubMed
- 8. Raphael JC, Elkharrat D, Jars-Guincestre MC, Chastang C, Chasles V, Vercken JB, et al. Trial of normobaric and hyperbaric oxygen for acute carbon monoxide intoxication. Lancet 1989;2:414-9. https://doi.org/10.1016/s0140-6736(89)90592-8ArticlePubMed
- 9. Annane D, Chadda K, Gajdos P, Jars-Guincestre MC, Chevret S, Raphael JC. Hyperbaric oxygen therapy for acute domestic carbon monoxide poisoning: two randomized controlled trials. Intensive Care Med 2011;37:486-92. https://doi.org/10.1007/s00134-010-2093-0ArticlePubMed
- 10. Ducasse JL, Celsis P, Marc-Vergnes JP. Non-comatose patients with acute carbon monoxide poisoning: hyperbaric or normobaric oxygenation? Undersea Hyperb Med 1995;22:9-15.PubMed
- 11. Lee Y, Cha YS, Kim SH, Kim H. Effect of hyperbaric oxygen therapy initiation time in acute carbon monoxide poisoning. Crit Care Med 2021;49:e910-9. https://doi.org/10.1097/CCM.0000000000005112ArticlePubMed
- 12. Reisberg B, Ferris SH, de Leon MJ, Crook T. The Global Deterioration Scale for assessment of primary degenerative dementia. Am J Psychiatry 1982;139:1136-9. https://doi.org/10.1176/ajp.139.9.1136ArticlePubMed
- 13. Haukoos JS, Lewis RJ. The propensity score. JAMA 2015;314:1637-8. https://doi.org/10.1001/jama.2015.13480ArticlePubMedPMC
- 14. Austin PC. Statistical criteria for selecting the optimal number of untreated subjects matched to each treated subject when using many-to-one matching on the propensity score. Am J Epidemiol 2010;172:1092-7. https://doi.org/10.1093/aje/kwq224ArticlePubMedPMC
- 15. Austin PC. Optimal caliper widths for propensity-score matching when estimating differences in means and differences in proportions in observational studies. Pharm Stat 2011;10:150-61. https://doi.org/10.1002/pst.433ArticlePubMed
- 16. Rubin DB. Using propensity scores to help design observational studies: application to the tobacco litigation. Health Serv Outcomes Res Methodol 2001;2:169-88. https://doi.org/10.1023/A:1020363010465Article
- 17. Hampson NB, Simonson SG, Kramer CC, Piantadosi CA. Central nervous system oxygen toxicity during hyperbaric treatment of patients with carbon monoxide poisoning. Undersea Hyperb Med 1996;23:215-9.PubMed
- 18. Thom SR, Bhopale VM, Han ST, Clark JM, Hardy KR. Intravascular neutrophil activation due to carbon monoxide poisoning. Am J Respir Crit Care Med 2006;174:1239-48. https://doi.org/10.1164/rccm.200604-557OCArticlePubMedPMC
- 19. Piantadosi CA, Zhang J, Levin ED, Folz RJ, Schmechel DE. Apoptosis and delayed neuronal damage after carbon monoxide poisoning in the rat. Exp Neurol 1997;147:103-14. https://doi.org/10.1006/exnr.1997.6584ArticlePubMed
- 20. Thom SR, Bhopale VM, Fisher D, Zhang J, Gimotty P. Delayed neuropathology after carbon monoxide poisoning is immune-mediated. Proc Natl Acad Sci U S A 2004;101:13660-5. https://doi.org/10.1073/pnas.0405642101ArticlePubMedPMC
- 21. Thom SR. Functional inhibition of leukocyte B2 integrins by hyperbaric oxygen in carbon monoxide-mediated brain injury in rats. Toxicol Appl Pharmacol 1993;123:248-56. https://doi.org/10.1006/taap.1993.1243ArticlePubMed
- 22. Hampson NB, Dunford RG, Ross DE, Wreford-Brown CE. A prospective, randomized clinical trial comparing two hyperbaric treatment protocols for carbon monoxide poisoning. Undersea Hyperb Med 2006;33:27-32.PubMed
- 23. D’Agostino RB Jr. Propensity score methods for bias reduction in the comparison of a treatment to a non-randomized control group. Stat Med 1998;17:2265-81. https://doi.org/10.1002/(sici)1097-0258(19981015)17:19<2265::aid-sim918>3.0.co;2-bArticlePubMed
- 24. Kim SJ, Thom SR, Kim H, Hwang SO, Lee Y, Park EJ, et al. Effects of adjunctive therapeutic hypothermia combined with hyperbaric oxygen therapy in acute severe carbon monoxide poisoning. Crit Care Med 2020;48:e706-14. https://doi.org/10.1097/CCM.0000000000004419ArticlePubMed
- 25. Cho DH, Ko SM, Son JW, Park EJ, Cha YS. Myocardial injury and fibrosis from acute carbon monoxide poisoning: a prospective observational study. JACC Cardiovasc Imaging 2021;14:1758-70. https://doi.org/10.1016/j.jcmg.2021.02.020ArticlePubMed
 PubReader
 ePub Link
 Cite
Cite


